Most paddlers plan river trips the same way: they ask a friend if the water's "good" or scroll through a kayak club's WhatsApp chat. That works if you happen to know someone paddling that river this week. USGS stream gauges, the government's real-time water-monitoring network, offer a better path: quantifiable data about flow, depth, and timing that applies the same way every time. Reading a gauge won't tell you if a rapid is fun or how the rocks set up mid-flood; it will tell you whether conditions are even safe to scout. This guide covers how paddlers use USGS data to check conditions before driving to the put-in, compare seasonal trends to plan annual trips, and avoid the surprise of arriving at a river that's either raging or a trickle.
Why Stream Gauge Data Matters for Paddlers
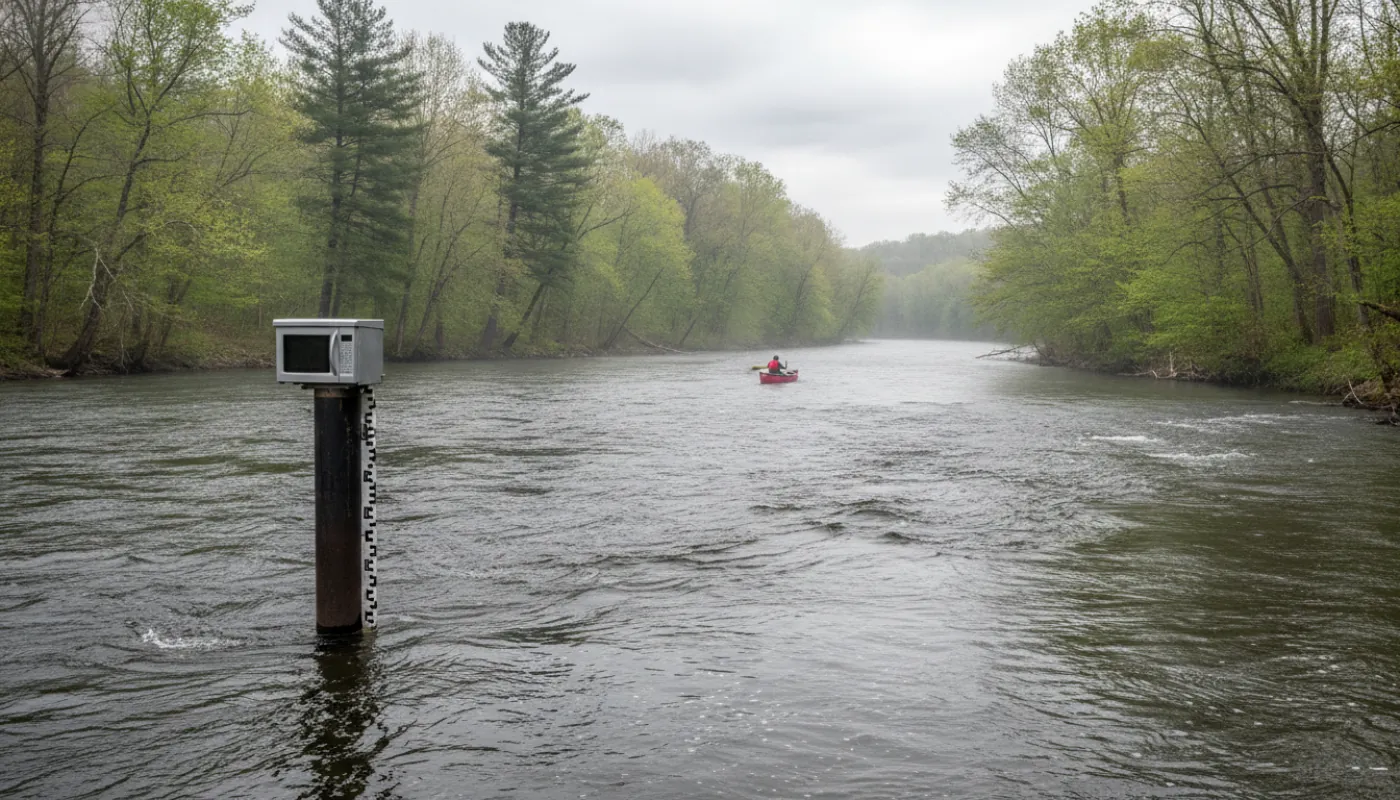
A USGS stream gauge is essentially a sensor mounted on a bridge or riverbank that measures water flow and depth (and, at some sites, temperature). Most gauges record at 15-minute or hourly intervals and post to the free USGS website shortly after, check the timestamp on the gauge page for its actual refresh cadence, accessible from your phone in the parking lot. For a paddler, this is the difference between guessing and knowing: you can check conditions in real time before the drive, before the shuttle, before you've committed money and time to a trip.
The practical value becomes clear fast. A gauge tells you whether today's rain actually raised the river enough to paddle, or if another week of dry weather is needed. It shows you the difference between "high but manageable" and "actually dangerous." For a guided livery or whitewater school, gauges are part of the day's safety math: an operator checking the gauge at dawn knows whether to offer easy floats or pull from the schedule altogether. For a solo paddler or small group, it's the accountability you don't have when someone just says the water looks fine. A gauge doesn't replace scouting, you will still need to see the river in person before committing to harder sections, but it answers the yes-or-no question first: should I even go today?
Understanding USGS Gauge Terminology and Metrics
USGS gauges track three key measurements, and each one tells part of the story. The most important for paddlers is streamflow, reported in cubic feet per second (CFS). CFS describes volume: how much water is passing a point per second. A river at 500 CFS is moving roughly one-fifth the water of the same river at 2,500 CFS. Higher flow generally means stronger current, bigger waves, and faster drops, all factors that change the difficulty and risk of a paddle. Most paddling resources (guidebooks, local clubs, outfitter websites) reference safe paddling windows in CFS. Once you know the CFS range for your local runs, the gauge becomes your primary filter.
The second metric is stage or water level, measured in feet of depth above a reference point. Stage affects the technicality and hazards of a rapid: a 4-foot stage might mean boulders break the surface; at 6 feet, those rocks are submerged and the line is cleaner. At 8 feet, the whole character changes, what was technical might now be heavy and pushy. Gauges at some sites also report water temperature, check the parameter list on the page, which matters for cold-water safety and PFD selection. Of these, streamflow is your first decision point (go or don't go), stage refines your line selection and hazard awareness, and temperature, where it's reported, reminds you to dress for immersion. Most experienced paddlers focus on CFS, check stage as a secondary detail, and confirm water temperature (from the gauge if it has a sensor, or another local source), before launching on cold rivers.
Finding and Interpreting Your Local Gauge
Start at waterdata.usgs.gov. The site lists thousands of USGS and cooperator gauges nationwide, mapped and searchable by river name and state (some regions also rely on non-USGS gauges run by state, tribal, or other federal agencies). Type your local river into the search box, if there's a gauge, you'll see a page dedicated to it. The main display shows current conditions: today's streamflow, the stage, recent precipitation, and a live hydrograph (a graph showing flow over the past 7–30 days). Bookmark the page so you can check it before every paddle.
The hydrograph is the most useful view for a paddler. The left side shows current flow; the horizontal line through the middle represents the median flow for that date (what's "normal" for late July, for instance). If today's line is well above that median, the river is running high. If it's below, it's low. The slope matters too: a steep climb means water is rising fast (usually from recent rain), while a gradual descent means flow is dropping. A paddler looking at a steep climb might wait a day for the peak to settle; a steady rise or plateau might be your paddling window. The USGS also publishes historical data: if you click into a gauge's page, you can pull up years of flow history, which tells you seasonal patterns. The ability to see what flow looked like in May of past years is useful planning information for a trip you're considering in June.
Converting Gauge Data Into Real Launch Decisions
Reading a gauge is only useful if you know what CFS means for your river and your skill. The best source is a local guidebook, paddling club, or outfitter: what CFS range does the Class II section of your favorite run feel safe and fun? What's the absolute maximum flow you'd consider for your kayak and body weight? Write those thresholds down. When you check the gauge, you're testing: is today's flow in my safe zone? If the gauge shows 400 CFS and your zone is 250–600, you're in bounds. If it shows 1,500 CFS and your max is 700, the answer is no, today isn't the day.
This is also where local knowledge matters most. A gauge measures flow at one fixed point, often miles upstream from popular put-ins. A tributary that dumps significant water between the gauge and the takeout isn't reflected in the gauge number. Big rain in the afternoon could raise flow within hours. Your own repeated scouting trips teach you what a given CFS looks like and feels like on the water, which no gauge alone can convey. Use the gauge to narrow the field (yes, this river is currently in a paddleable range), then use judgment and observation for the final call. If flow is in your zone but the water looks dangerous when you arrive (strong undercuts, woody debris jams, unusual color), trust what you see. The gauge is a filter, not a permission slip.
Building a Gauge-Watching Habit
The paddlers who get the most from USGS data make it a seasonal habit. Before spring, identify every river you want to paddle and bookmark its gauge. Check the gauges weekly, even when you're not planning a trip, you start to feel the seasonal rhythm. Spring usually sees higher water (snowmelt, rain), summer settles into a predictable low-water window, fall rises again with cooler rains, and winter typically peaks. That pattern is different for every river and every region, but watching for a few months teaches it to you. USGS WaterAlert (water.usgs.gov/wateralert) is a free service that lets you set a threshold and get an email or SMS when a gauge crosses it, a separate signup rather than a per-page toggle. This is useful for paddlers managing a trip plan: set a low-flow alert for late summer, and when the gauge crosses your threshold, you know the window is open.
Keep a simple log: the dates you paddled, the CFS on those days, and one sentence about how the conditions felt. Over a year or two, you build your own reference chart. A flow number attached to a memory of how the rapids felt becomes data you trust more than any guidebook. Share your observations with local clubs and paddling friends; a community of paddlers watching the same gauge builds collective knowledge faster. The USGS does the work; the gauge is just a tool. What turns it into wisdom is repeated attention and paddling.