Ottawa City Rafting
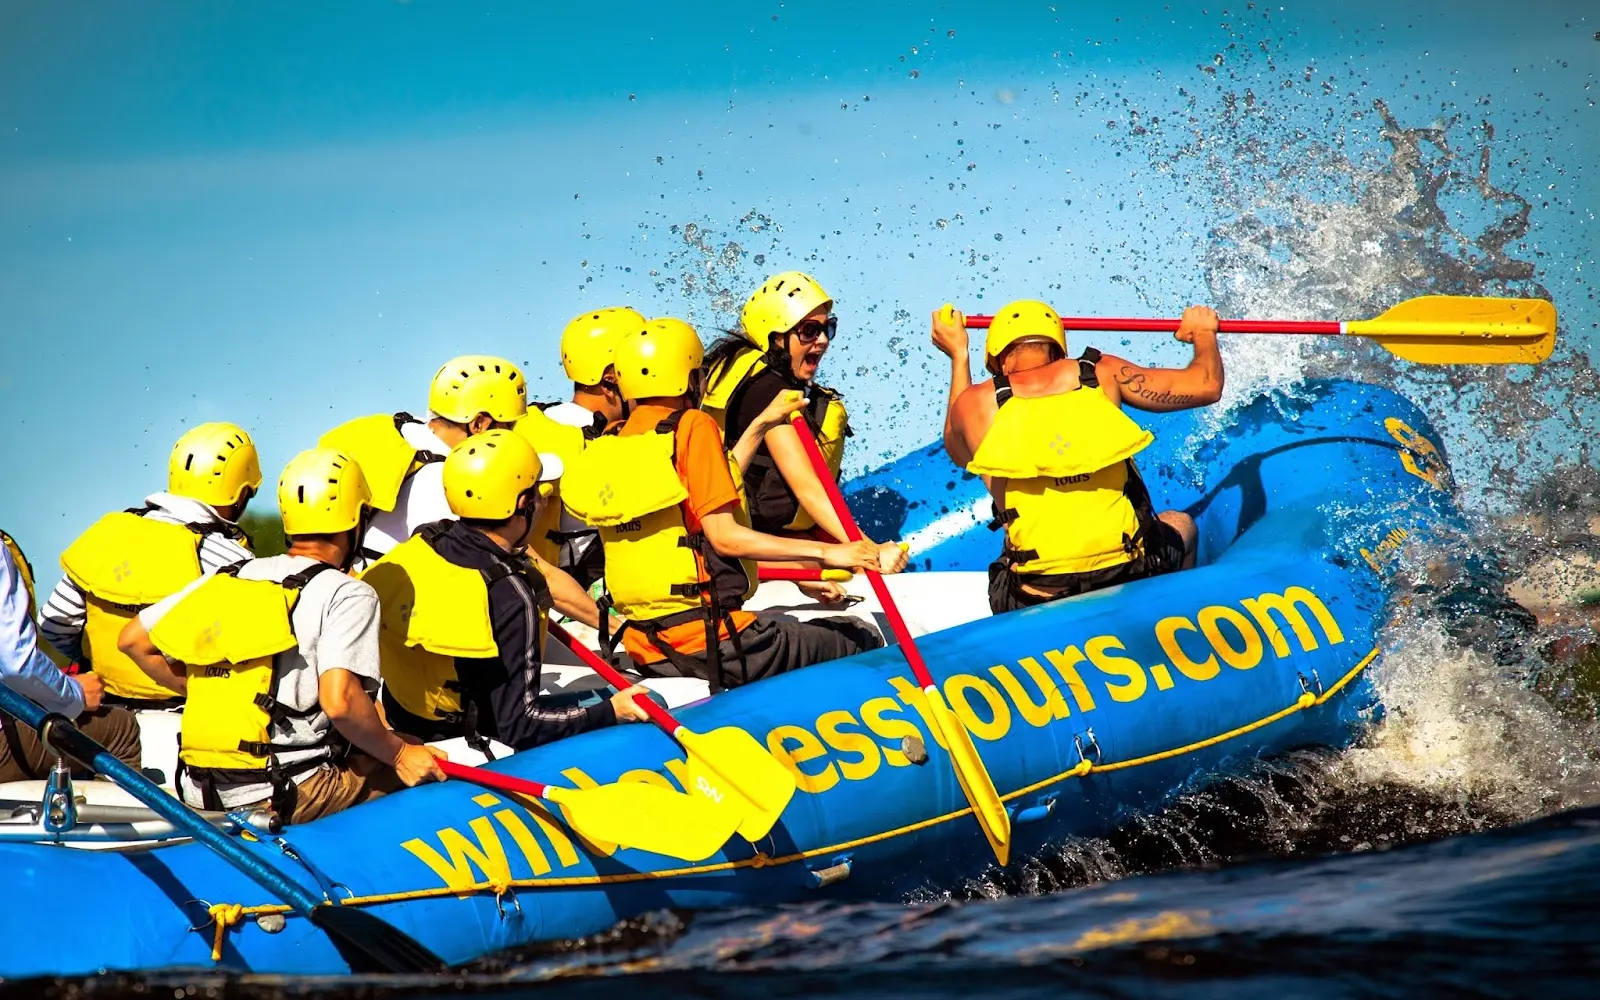
Ottawa City Rafting is a rafting outfitter based in Ottawa, ON.
Gallery
Outfitter details
- Disciplines
- Rafting
Around here
Around Ottawa City Rafting
Source: Canadian Geographical Names Database (NRCan), Open Government Licence - Canada · Public land: USGS PAD-US
Typical flow by month
1960 to 2024
The water at Ottawa City Rafting typically runs highest in April, at a median 71,777 cfs, and lowest in September, at 21,118 cfs. The highest flow on record for any single day is 211,182 cfs, in 2019.
Show the numbers
| Month | Typical (cfs) | Usual range (cfs) |
|---|---|---|
| January | 45,203 | 37,080 to 51,648 |
| February | 44,497 | 37,963 to 49,794 |
| March | 43,437 | 35,844 to 51,736 |
| April | 71,777 | 55,047 to 91,200 |
| May | 70,100 | 45,909 to 96,144 |
| June | 44,143 | 31,607 to 55,488 |
| July | 28,676 | 22,990 to 34,785 |
| August | 23,343 | 17,198 to 29,382 |
| September | 21,118 | 16,245 to 26,292 |
| October | 26,945 | 20,306 to 36,727 |
| November | 39,552 | 28,163 to 53,325 |
| December | 43,437 | 35,315 to 49,794 |
Typical is the median of each month’s daily median values, and the usual range runs from the median 25th to the median 75th percentile, across about 65 years of record. Statistics published by the US Geological Survey for Ottawa River at Britannia (site 02KF005). Conditions on any given day can fall well outside the usual range. Check the current reading before you go.
Current conditions
Air quality
25 Good
Gatineau - Hull monitor, 10 km
From free public NOAA / USGS feeds. Air quality: Canada-Quebec1 via EPA AirNow. Preliminary data, not verified.
More outfitters


Also nearby
Other ways to get outside within about an hour of here.
Free tools